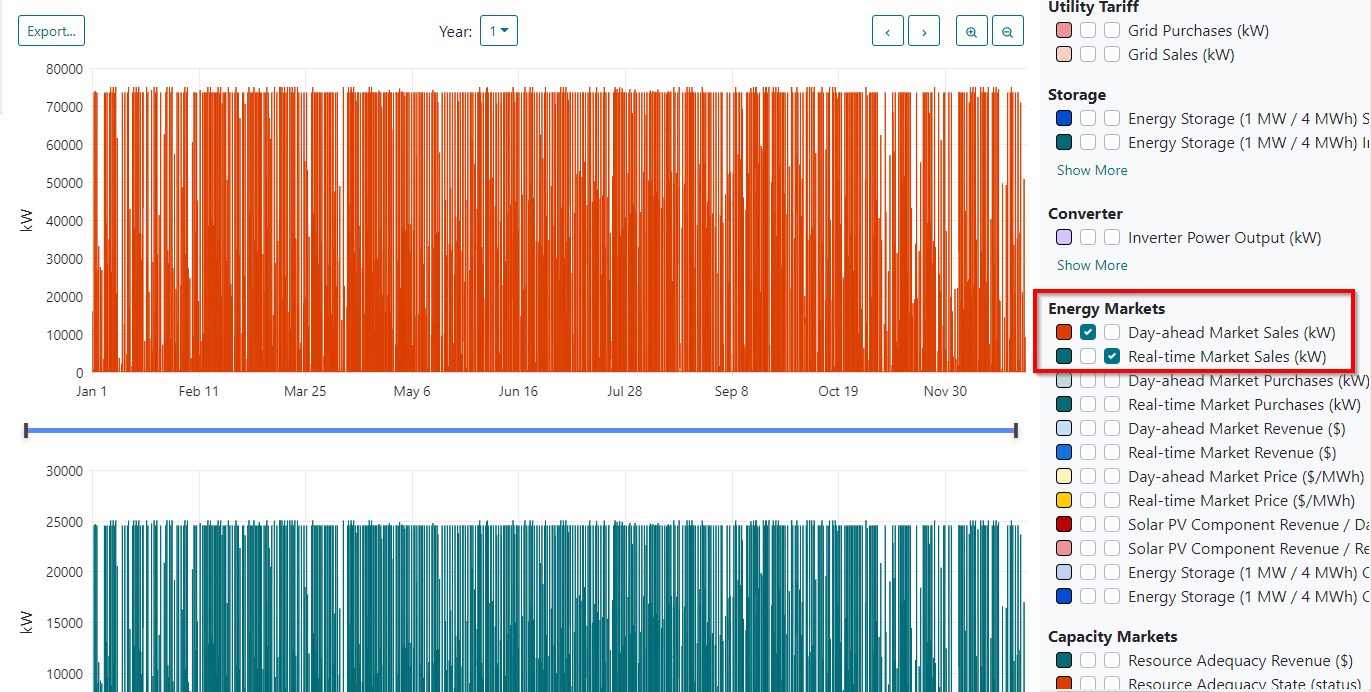
The Time Series Graphics can graph a number of model variables over the duration of the simulation. The granularity is defined by the time-step of your model.
Select which time series to view by checking the left checkbox to display in the upper plot and the right checkbox to display in the lower plot. You may click on the color to customize it.

The line plot shows one year of the system’s performance. Change the year in the year selector at the top of the plot.
Export
The export button exports the time series of the year selected in the year selector dropdown, in CSV format. Choose or enter a location and name for the output file.