HOMER Pro 3.15

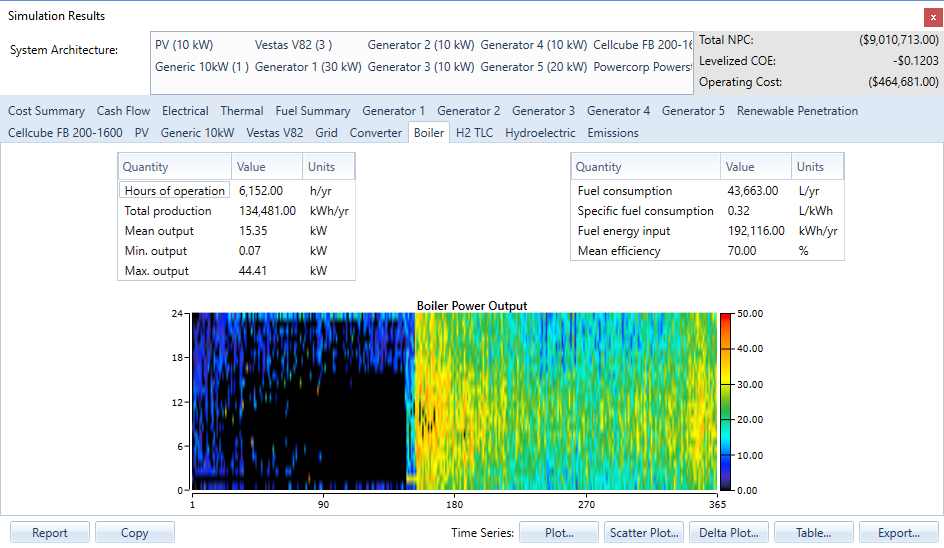
Click the Copy button in the bottom left corner of the Simulation Results window to copy the simulation results to the clipboard.

The results data for this simulation are copied to the clipboard in a format that you can paste into a spreadsheet application like Microsoft Excel (tab-delimited text). The arrangement of the data is described in the table below. The locations described assume that you paste the data beginning with cell A1. Each piece of result data generally appears in the same cell location, even for different simulations or different HOMER models. This makes it easier for other spreadsheets to reference the pasted results data by referencing specific cells.
|
Spreadsheet Row Number |
Contents |
|
1 |
Title, description, filename |
|
2 |
Project notes |
|
3 |
Total NPC |
|
4 |
LCOE |
|
6-9 |
System architecture |
|
11-12 |
Sensitivity case parameters |
|
14-20 |
Cost summary table (Net present dollars) |
|
22-28 |
Cost summary table (Annualized dollars) |
|
30-32 |
Electrical summary |
|
34-36 |
Other outputs |
|
38-40 |
Thermal summary |
|
42-46 |
Fuel summary |
|
48-50 |
Emissions summary |
|
60-89 |
Generators |
|
90-109 |
PVs |
|
110-129 |
Wind turbines |
|
130-159 |
Batteries |
|
160-179 |
Converter |
|
180-199 |
Boiler |
|
200-219 |
Hydro |
|
220-239 |
Reformer |
|
240-259 |
Electrolyzer |
|
260-269 |
Hydrogen tank |
|
270-289 |
Hydrokinetic |
|
290-309 |
Grid |
|
310-319 |
Thermal load controller |
