
HOMER Pro 3.15

![]()
Important: This option is part of the Advanced Grid module. See Adding Modules for more information on purchasing modules.
In Real Time Rates and Scheduled Rates Grid modes, the Reliability tab allows you to specify grid outages to model an unreliable grid. You can schedule outages by time of day and month of the year. You can set parameters to generate random outages throughout the year. Outages are modeled as one or more time steps in which no electricity can be purchased from or sold to the grid.
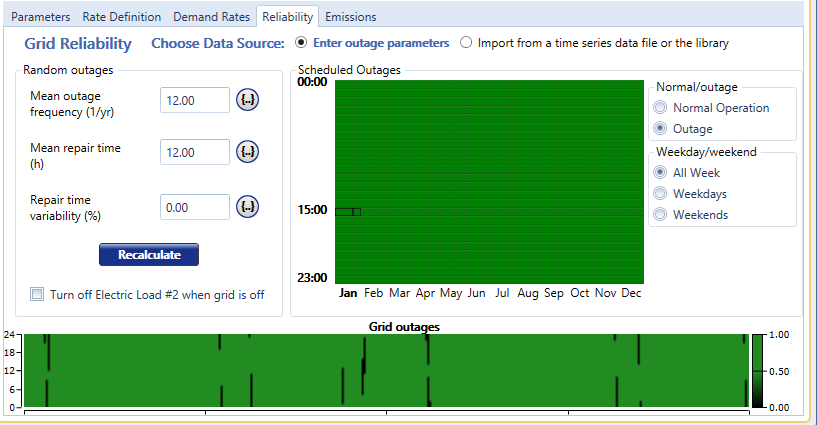
Scheduled Outages
You can draw the outage schedule on the Scheduled Outages chart by clicking or clicking and dragging the mouse on the chart. You can select the Normal Operation or Outage radio buttons on the right. Select Outage to draw outages on the chart, and Normal Operation to "erase" outages. The thin columns on the chart represent weekends, and the thick columns represent weekdays for each month. Select All Week, Weekdays, or Weekends from the radio buttons on the right to change the columns you are drawing.
In the example above, there is an outage every night from midnight to 2 a.m., and outages on January weekdays from 4 a.m. to 11 a.m. and December weekdays from 3 a.m. to 11 a.m. There are also outages on weekends in May through August from noon to 11 p.m., and outages on weekdays from 11 p.m. to midnight. The Random outage schedule is overlaid on top of the scheduled outages in the Grid outages chart.
Random Outages
Specify the failure frequency and duration using the inputs. HOMER generates the outage time series and displays the outages in the Grid outages DMap below. Outages appear in black; regular grid operation appears in green. The grid outage time series, as displayed here, is used in all simulations.
|
Variable |
Description |
|
Mean failure frequency |
Number of times the grid will fail per year. |
|
Mean repair time |
Mean duration of grid outages, in hours. |
|
Repair time variability |
The standard deviation of a grid failure duration, expressed as a percentage of the mean. Percentages higher than 100% are allowed. |
Algorithm
HOMER generates each random outage by selecting a pseudo-random time step from the year-long simulation period. HOMER then chooses the duration of that outage by selecting a pseudo-random number from a normal distribution specified by the "Mean repair time (h)" and "Repair Time Variability (%)" inputs.
HOMER tries to generate distinct, non-overlapping outages equal to the number specified for "Mean outage frequency (1/yr)", without considering scheduled outages. As it chooses the time-step index for each outage, HOMER only chooses an index that does not overlap with an existing outage, if possible. If there are too many outages (or the durations are too long), some outages do overlap. Because this algorithm does not take the scheduled outages into consideration, the outages from this random algorithm are combined with those from the Outage Schedule to generate the final outage time series.
Import Time Series
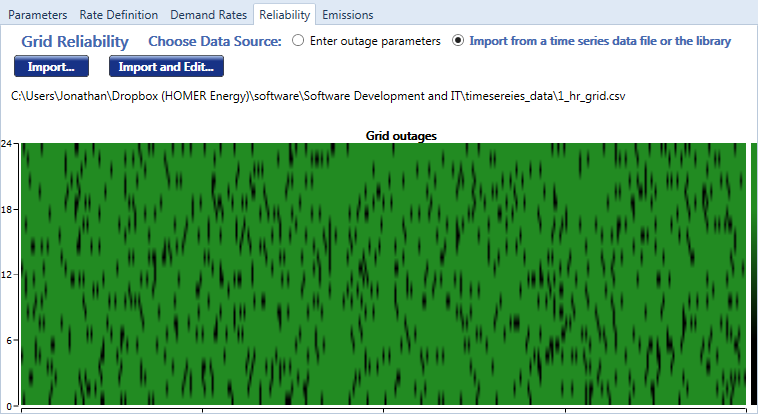
You can import your own time series of grid outages. Select the "Import from a time series data file or the library" option at the top of page under the Reliability tab. Two buttons appear: "Import..." and "Import and Edit..." You can use either of these functions to import your own text file time series of outages.
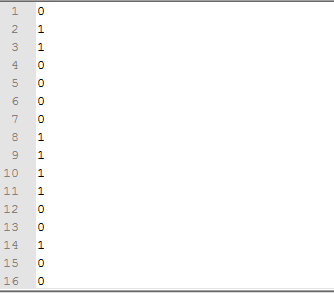
Your data file should contain a single column of zeros and ones, without any headers or row titles. A one (or any non-zero number) indicates that the grid is operational during the corresponding time step. The system can purchase from and sell to the grid. A zero indicates that the grid is off for the corresponding time step. During the time step where the grid is off, corresponding to an outage or failure, the system cannot buy from or sell to the grid.
For all data imported from a file, HOMER infers the time step by the number of rows in the data file and assumes that the data is of a one-year duration. For a file with 8,760 rows, HOMER assumes it is hourly data (there are 8,760 hours per year). If the file contains 525,600 rows, HOMER assumes it contains one-minute data. HOMER can read files with several integer time steps between one hour and one minute: 1, 2, 3, 5, 6, 10, 12, 15, 20, 30, and 60 minutes are valid time step sizes. The following image shows grid outages imported from a file.
In HOMER, January 1st is always a Monday. Because the standard year starts on a Monday, you might need to adjust your price time series to match. If any part of your HOMER model is sensitive to weekdays versus weekends (i.e., a load that is higher on weekdays), you may need to modify your grid rate data so that the first day is a Monday. You can usually adjust your data to start on a Monday by cutting a few days from the beginning of the load profile and pasting them at the end (or vice versa). Keep in mind that if you view the hourly time series plot for your simulation, your load is shifted by the number of days you moved.
