HOMER Pro 3.15

![]()
Important: This option is part of the Advanced Grid module. See Adding Modules for more information on purchasing modules.
For the Real Time Rates and Scheduled Rates Grid modes, the Demand Rates tab allows you to specify a demand rate structure for the grid.
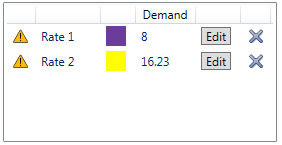
Rate Table
You can define several rates and use the Demand Rate Schedule chart to indicate when each rate applies. Each rate can have a different value for the Demand rate, and different storage control settings.
You can change the properties of a rate in the rate table under Step 1. Click the  button to create a new rate. With that row
highlighted in the table, click in the Demand Rate Schedule chart and drag over the chart to schedule the
new rate.
button to create a new rate. With that row
highlighted in the table, click in the Demand Rate Schedule chart and drag over the chart to schedule the
new rate.
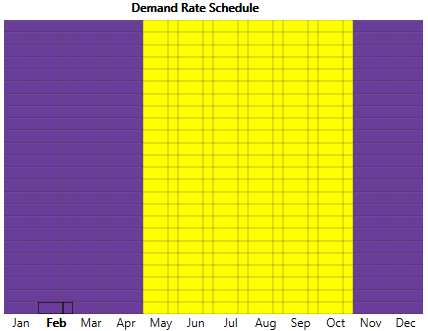
If the Demand rate does not depend on the time of day or day of the year, you only need to define a single rate. In the following example, two demand rates are defined. During Rate 2 (May through October), the demand charge is $16.23 times the peak demand (in kW) for each month. During Rate 1 (November through April), each month has a demand charge equal to $8 times the peak demand (in kW).
Rate Properties
Each Demand rate can be defined in its Rate Properties pop-up window. Click the  button next to a rate to access this window.
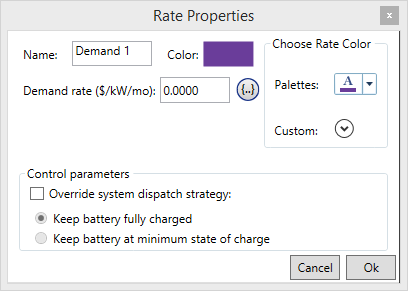
This window allows you to view and edit the properties of a Demand rate, including the following.
|
Variable |
Description |
|
Name |
The name HOMER uses to identify the rate. |
|
Demand Rate |
The monthly fee charged by the utility on the monthly peak demand, in $/kW/month. |
|
Override system dispatch strategy |
If checked, HOMER does not use its economic decisions and instead forces the storage to maintain the state of charge selected below. |
|
Keep storage fully charged |
Keep the storage fully charged unless the energy is needed to avoid a capacity shortage. |
|
Keep storage at minimum state of charge |
Sell or use all storage energy whenever possible, and only charge the storage when there is excess electricity. This is most applicable in systems where renewable generation can exceed the grid sale capacity. |
Schedule
The Demand Rate Schedule shows the times at which each rate applies. If you defined multiple rates, highlight a rate. Click a specific time on the Demand Rate Schedule chart and drag the cursor to indicate when the rate applies. In the following example, Rate 2 applies all days May through October. Rate 1 applies at all other times. To draw the schedule shown below, click the first row in the rate schedule cell for May, and then holding the mouse button down, drag to the bottom cell for October and release the mouse button.