The Augmentation results page provides a detailed view of storage Augmentation for the selected system.

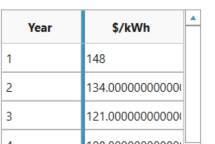
Left chart: Augmentation Capacity shows how the capacity degrades over the course of the year and the capacity that is augmented. Right chart: Augmentation Cost plot shows the price curve specified as an input as the line plot. The bar plot shows the total cost of augmentation, which is the augmented capacity multiplied by the interpolated price per kWh.
Review the tables for a detailed explanation of each variable.
|
Variable |
Description |
|
Maximum usable energy capacity |
Maximum usable energy capacity show the highest capacity of the storage during that year. The data shows the battery degradation over the course of the year and when the system is augmented. |
|
Minimum usable energy caacity |
Minimum usable energy capacity show the lowest capacity of the storage during that year. The data shows the battery degradation over the course of the year and when the system is augmented. |
|
Augmentation (%) |
Augmentation (%) is percent of the original capacity that is augmented during that year. |
|
Augmentation capacity (MWh) |
Augmentation capacity (MWh) is the energy storage capacity that is augmented, equal to the augmentation degradation limit times the storage capacity at COD. |
|
Augmentation cost ($/MWh) |
Augmentation cost is the price curve defined in the inputs. These represent the price to augment the system on Jan 1. Battery Augmentation Cost uses the interpolated price per kWh on the date of augmentation times the capacity augmented. |
Question: Augmentation – the $ amounts are not correct. 3.6% of the capacity or 14,399 kWh should be added in the second year at $123/kWh for a total of $1,775k. The cash flow from HOMER says $1,936k
Answer: Augmentation is extrapolated between the years. So the cost that you define for year 2, means the price on Jan 1 in yr 2.
Looking at the timeseries, the augmentation seems to happen on 12/31 in year 2, so it is more correct to use the year 3 cost: $121/kWh * 4% * 400,000kWh = 1,936,000$. This is consistent with the cashflow in year 2, which lists $1,936,001.
