HOMER Pro 3.15

![]()
The Optimization page under the Project tab allows you to control how HOMER finds the optimal system. The Optimization page is divided into two parts. On the left are the Optimization Settings, where you can apply rules to exclude some kinds of systems from the optimization. On the right are Optimizer Settings that control certain aspects of the numerical optimization.
Optimization Settings
HOMER uses the simulation time step to simulate the operation of each system configuration. You can set this value by selecting one of the values between one hour and one minute from the "Minutes per time step:" drop-down menu. The simulation time step does not have to match the time step of any time series load or resource data you may have imported. See the simulation time step section of the help for details.
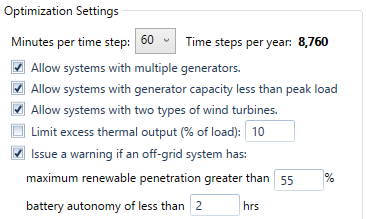
The other options in this section allow you to exclude systems that meet certain criteria, or flag certain systems with a warning.
|
Variable |
Description |
|---|---|
|
Allow systems with multiple generators |
If checked, HOMER considers systems that contain more than one generator. It has no effect if you are considering only one generator. |
|
Allow systems with two types of wind turbines |
If checked, HOMER simulates system configurations that contain more than one type of wind turbine. If you add two types of wind turbines to the schematic and only want to choose between them, leave this check box unchecked. If you want HOMER to simulate systems that contain both types of turbines, check this check box. |
|
Limit excess thermal output |
If checked, HOMER prevents the system from producing more than the allowable amount of excess thermal energy. |
|
Issue a warning if an off-grid system has ... |
If checked, HOMER issues warnings in the results for systems that meet the criteria you specify here. |
The Optimizer
You can use the HOMER Optimizer for the Converter, Storage, PV, and Wind Turbine Components. Click the HOMER Optimizer radio button to enable the Optimizer. Check the Advanced button to change the Upper and Lower values.
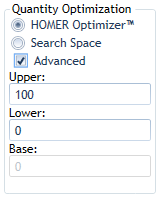
If you enable the Optimizer for a component, you do not need to enter a Search Space number for that component, only the lower and upper limits of the range to consider. HOMER compares the quantities between the upper and lower bounds with the base. The default for the Base is 0. HOMER automatically finds the optimal size or quantity for you. You can optimize up to four components at a time. You can also mix components that are optimized with those that have regular Search Space entries together in one model. In that case, HOMER runs one optimization for each combination in the Search Space.
Using the Optimizer with a Search Space
For example, if you have a PV with a regular Search Space (shown above, left) and several other components with the Optimizer enabled (shown above, right), HOMER runs an optimization with each Search Space value on the list. If you have 0, 1, 2, and 3 in the table, you will see the optimal system configuration for the system with no PV, and with a PV capacity of 1 kW, 2 kW, and 3 kW. All the optimization results are listed together in the Optimization Results table on the Results page. You can compare the optimal systems with each size of PV, to find the best overall system. You can also sort and filter on PV size to see only results from one optimization at a time.
Tip: If you are considering a small number of wind turbines (i.e., 0, 1, or 2 turbines), it may be better to enter the quantities in the Search Space, and not use the Optimizer. The same applies to batteries. If you are considering four or more different quantities of wind turbines or batteries, using the Optimizer may be a good choice.
Optimizer Settings
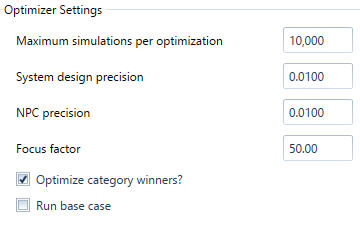
The Optimizer Settings section of the Optimization page contains inputs that affect how the numerical optimization algorithm operates.
|
Variable |
Description |
|
Maximum simulations per optimization |
HOMER runs one optimization for each combination of Search Space variables (explained above). HOMER also runs an optimization for each system category if "Optimize category winners?" (below) is selected. This option limits the number of simulations for each optimization. |
|
System design precision |
This sets the maximum relative precision of decision variables allowed for convergence. There must be at least N systems closer than this from the best system, where N is the number of dimensions in the optimization. Distance is calculated as a fraction of the total range you specify for each decision variable (upper limit minus the lower limit). |
|
NPC precision |
This sets the maximum relative error in net present cost (NPC) required for convergence. The average NPC of the N systems closest to the best system must be within the specified fraction of the best system's NPC, where N is the number of dimensions in the optimization. This input is interpreted as a fraction of NPC. |
|
Focus factor |
This setting controls how evenly HOMER covers the optimization space with points (where each point is a system configuration). A low focus factor covers the space more evenly. A high focus factor concentrates points near existing points with a low NPC. Optimizing with a higher focus factor tends to converge more quickly, with fewer total simulations needed, but can risk getting stuck in a local optimum. |
|
Optimize category winners? |
Run additional optimizations with and without each component in the system; if this is not selected, only the overall winner is optimized, and category winners may not be good. |
The System design precision specifies the relative error in the decision variables (i.e., PV array capacity) below which convergence is allowed. If the NPC precision criterion is also satisfied, the optimization is finished. The system design precision is specified as a fraction of the total range of each component. For example, consider a system where the PV capacity (minimum 0 kW, maximum 100 kW) and the storage quantity (minimum 0, maximum 300) are both being optimized. A precision setting of 0.01 means plus or minus 1 kW of PV, and plus or minus 3 batteries.
The NPC precision convergence criterion must also be met for convergence. Once both criteria are met, the optimization is finished. The NPC precision is relative to the best system's NPC. For example, the current best system has an NPC of $67,000, and the NPC precision is 0.01. If the average difference in NPC of the nearest N points is less than $670, the NPC precision criterion is satisfied.
The Maximum simulations per optimization prevents the optimization from running forever if it can't converge. For example, you want to optimize four variables with the default system design and NPC precision of 0.01. If you choose a low focus factor, the guess points are evenly distributed over the four-dimensional space. With the system design precision of 0.01, you would need roughly 100 points in each dimension. For four dimensions, that's 100^4 or 100 million points. The maximum simulations per optimization prevents the optimization from trying to do that.
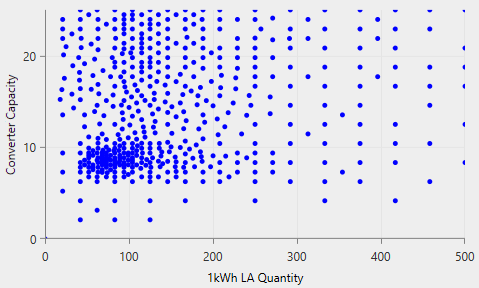
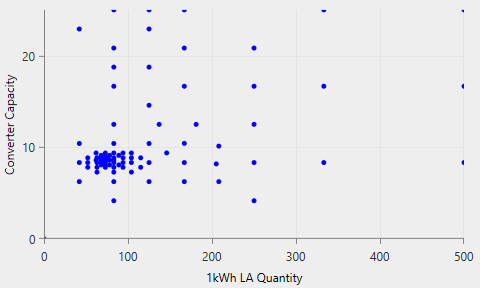
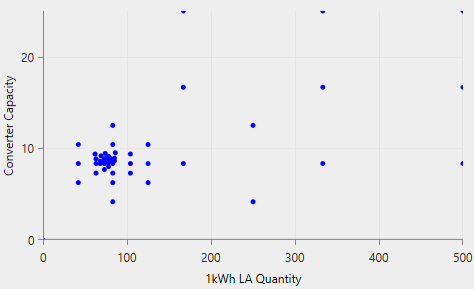
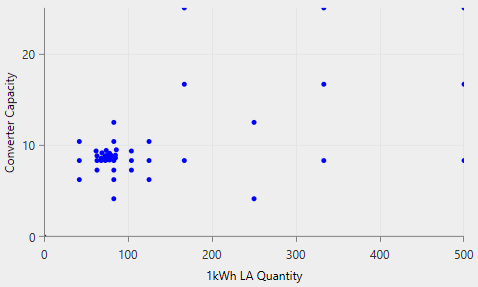
Increasing the Focus Factor causes the points evaluated during optimization to be clustered more around the optimal system. A typical point distribution for a two-dimensional optimization is pictured below for different values of the Focus Factor. On the plots below, each point represents a system that was evaluated. No data is plotted for the resulting NPC for each system, but you can guess where the lower NPC systems are because the points are clustered together around the optimal point.
|
Focus factor = 1 |
Focus factor = 3 |
|
Focus factor = 15 |
Focus factor = 50 |
The default setting for the Focus Factor is 50, which produces results rapidly, and is good for designing and iterating. Before finalizing a design, you may want to try a lower Focus Factor (i.e., 5 or 10) and run the optimization again. It takes longer, but you can be more confident that the solution reported is the global optimum. You might consider increasing the maximum simulations per optimization input to accommodate a lower Focus Factor.
Running Calculate with the Optimizer
When you click the Calculate button, HOMER may perform many optimizations: one optimization for each Search Space combination, and also for each system category. The theoretical maximum number of simulations per calculation can be many times more than the maximum number you specify in Maximum Simulations per Optimization. For example, for a system with a generator, storage, converter, and PV, you set the optimizer for the storage and converter, and PV. You also set the Optimizer to optimize the category winners (the default). You enter 0 and 10 kW in the generator Search Space.
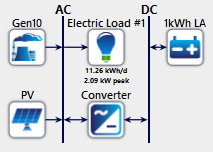
HOMER runs an optimization with the storage, converter, PV, and 10 kW generator (because you entered a 10 in the generator Search Space). If "Optimize category winners?" is selected, HOMER also tries to optimize the system with and without each of the storage, converter, and PV (all with the 10 kW generator still included). It runs an optimization with no storage, converter, or PV (generator only) and quickly realizes that there is not much to optimize (but the generator-only result is still included in the results). Then it optimizes the PV only, then the converter only, then PV and converter, then storage only, and so on (there are 2^3 combinations). Then HOMER repeats the whole process without the generator, for a total of 2^3 * 2 (=16) optimizations.
If the Maximum Simulations per Optimization setting is set to 10,000, then it would be possible to run up to 160,000 simulations in this example. This would not actually happen, because many of these combinations do not make sense (i.e., storage but no converter, nothing in the system at all, etc.). In these cases, none of the systems in the optimization space are feasible, and HOMER gives up quickly. In the viable combinations, each optimization runs to convergence. We expect that to happen well before 10,000 simulations are made, so the total number of simulations are much lower than 160,000.
If you are running a sensitivity analysis, HOMER repeats the entire process for each sensitivity case. When you add a sensitivity analysis to your HOMER model, the time HOMER takes to calculate is multiplied by the number of sensitivity cases you add. For more information on this, see Why would I do a sensitivity analysis?
See also
