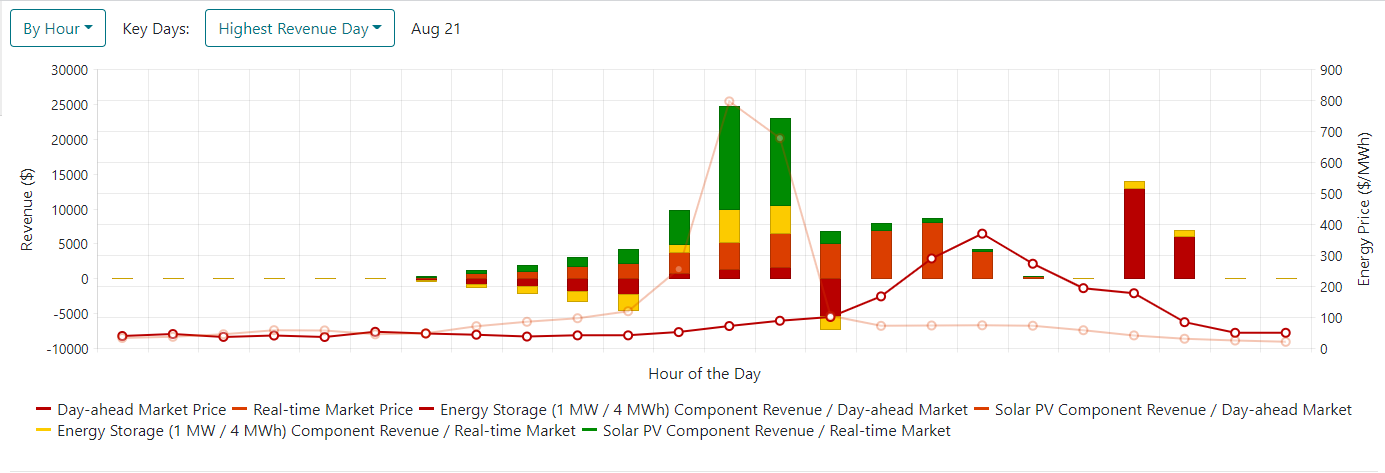
The Summary page provides an overview of the results for the selected system.

For a description of each variable in one of the tables, click on a link below.
Financial Summary
The financial summary in the summary section includes the following variables.
Variable |
Description |
The real discount rate if a function of the defined nominal discount and inflation rates. |
|
Project Life (years) |
The project life is the number of years simulated and is also the lifetime of the PV modules. |
Capital Expenses ($) |
Capital Expenses are the sum of all equipment capital expenses in year 0, excluding any replacement costs |
Operating Expenses ($) |
Operating Expenses are the sum of all equipment operating expense excluding any augmentation or replacement costs. |
Contract Participation |
Contract Participation identifies whether the application includes time of delivery contract |
Market Participation |
Market Participation identifies which energy markets are modeled |
Revenue ($/yr) |
Revenue ($/yr) is the average revenue over the project lifetime |
Internal Rate of Return (%) |
Internal Rate of Return (%) is the discounting rate that makes the Net Present Value equal to zero |
Net Present Value ($) |
Net Present Value ($) is the sum of all discounted cashflows |
Levelized Cost of Electricity ($/kWh) is the annualized cost of all equipment or components in the system divided by the annualized energy exported. |
Energy Price Summary
Energy Price Summary table may display these metrics, depending on the Application selection.
For each energy market the average purchase price and average sale price is displayed.
•Average purchase price is the total expenses associated with the market divided by the total imported energy.
•Average sale price is the total sale revenue associated with the market divided by the total exported energy.
Note: Time of Delivery and Capacity market will only display a sale price, since these do not have associated energy purchases.
Capacity market will show an average monthly Capacity Price ($/kW-mo)
Revenue Summary
The Revenue Summary may display these metrics, depending on the Application selection.
•Revenue from solar energy sold to specified energy market
•Revenue from storage energy sold to specified energy market
•Total revenue from energy sales to specified energy market.
For the Capacity Market, the energy discharged from the storage has associated revenue, plus capacity revenue from reserving storage capacity during the valid program schedule.
System Performance
The System Performance table may display the following metrics, depending on the Application and the Equipment selection.
Variable |
Description |
Solar Energy Production (MWh) |
Solar Energy Production is the annual production from the PV array. If it is a DC-coupled system, production is MWh-dc; if the system is AC-coupled, production is MWh-ac. |
Storage Throughput (MWh) |
Storage Throughput (MWh) is the amount of energy that cycles through the storage bank in one year |
Solar Energy to charge storage (MWh) |
Solar Energy to charge storage (MWh) is the energy supplied from the solar array to the storage system |
Grid energy to charge storage (MWh) |
Grid energy to charge storage (MWh) is the energy supplied from the grid to the storage system |
Clipped Solar Energy |
Clipped Solar Energy is the dc clipping from the solar dedicated converter. This will not include clipping from the system converter or the interconnection limit. |
Solar energy exported to each application (MWh) |
Solar energy exported to each application(MWh) is the energy exported from the solar array to the grid |
Storage energy exported to each application (MWh) |
Storage energy exported to each application(MWh) is the energy exported from the solar array to the grid |
Total energy exported (MWh) |
Total energy exported(MWh) is the sum of energy exported to the grid |
Energy storage mean state of charge (MWh) |
Energy storage mean state of charge(MWh) is the arithmetic average of the state of charge from each timestep |
Cycle Cost |
Cycle cost is the storage augmentation costs that the model attributes to the specific year divided by the year’s energy throughput times the estimated lifetime |
Energy storage grid import time |
Energy storage grid import time is a count of hours when any of the storage charging energy comes from the grid |
Energy storage grid export time |
Energy storage grid export time is a count of hours that the storage discharges |
Energy storage idle time |
Energy storage idle time is a count of hours idle in which the storage system neither charges nor discharges. |
Energy storage utilization rate |
Energy storage utilization rate is the annual output energy divided by the nameplate capacity divided by 365 days. For example, one full cycle per day has a utilization rate of one. |