
HOMER Knowledge Base
Why does HOMER Pro report such a high peak load?
HOMER Pro performs two separate processes to the load data you enter, both of which can affect the peak load. The two processes are scaling and adding random variability.
The scaling process changes the magnitude of the data without affecting its shape. You can enter load data (either by importing time series data or specifying daily load profiles) and then scale it by any factor you wish. That allows you to do a sensitivity analysis on the size of the load, or to change units from W to kW. Clearly, the scaling process will affect the peak load. If you scale the load data by a factor of 2, then the peak value of the scaled load will be twice that of the unscaled data.
An entirely different aspect of the load, but one which also affects the peak load, is random variability. If you specify the load data by entering one or more daily load profiles, then HOMER Pro offers the option of adding random variability. Real load data almost always has some component of random variability or noise, and HOME Pro's addition of random variability usually makes the load data more realistic. It also increases the peak load, without affecting the average load.
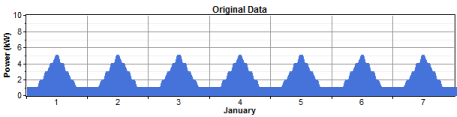
A few graphs will help clarify the difference between scaling and adding variability. Let's take a simple example where we enter a simple load profile and add no random variability, so that every day is the same as every other day. The resulting data might look like this:
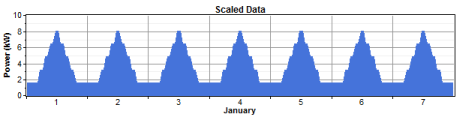
Scaling the original data changes its magnitude but not its shape, so that the peak load changes, but every day is still the same as every other day:
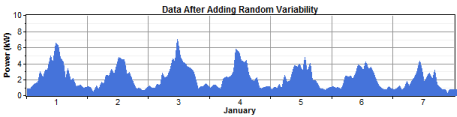
Adding random variability to the original data changes its shape but not its magnitude, so that every day would be unique:
If HOMER Pro reports a value of peak load higher than you expected, scaling or random variability or both may be the cause. If you do not want to add random variability, set the two random variability (noise) inputs to zero in the bottom left corner of the Primary Load Inputs window. If you do not want to scale the data, set the scaled annual average equal to the baseline annual average.
Tip: Real load data typically exhibits some random variability. If you enter daily load profiles without adding any random variability, you may be underestimating the peak load that the power system must serve.